Marvin contains a framework for integrating chemical computations into the drawing/viewing application environment. These tools - called plugins - are loaded dynamically upon request. ChemAxon provides various tools for calculating charge, pKa, logP, etc. The available calculator plugins are located in the Tools menu. Batch processing is available using Calculator (see the list of calculations accessible from Calculator).
Some plugins (Charge, Polarizability, Polar Surface Area, Molecular Surface Area and Hydrogen Bond Donor-Acceptor) optionally perform their computation on the major microspecies of the input molecule taken at a specified pH. This option together with the corresponding pH can also be set in the parameter panel.
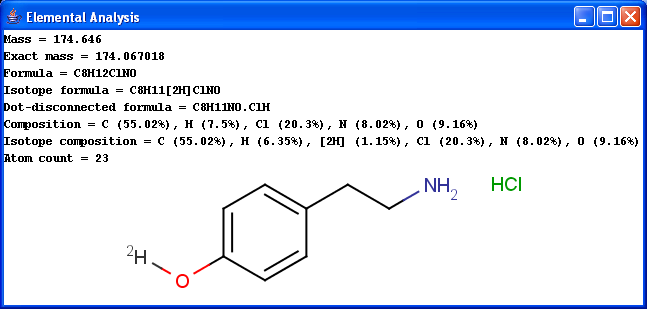
Basic molecular values related to the elemental composition of the molecule are displayed by the Elemental Analysis plugin.
Mass: molecular mass
Exact mass: molecular mass calculated from the most frequent natural isotopes of the elements
Formula: chemical formula of the molecule
Isotope formula: chemical formula of the molecule listing isotopes separately
Dot-disconnected formula: chemical formula of the molecule separating fragment formulas by dots.
Composition: elemental composition (w/w %)
Isotope composition: elemental composition listing isotopes separately (w/w %)
Atom count: number of atoms in the molecule.
|
By default, molecules are handled separately if more than one molecules are drawn in the sketcher. However, sometimes a single molecule consists of more fragments (e.g. salt molecules), in which case the fragments should be treated as one molecule. This behavior can be reached by switching off the "Single fragment mode" option in the corresponding Options panel.
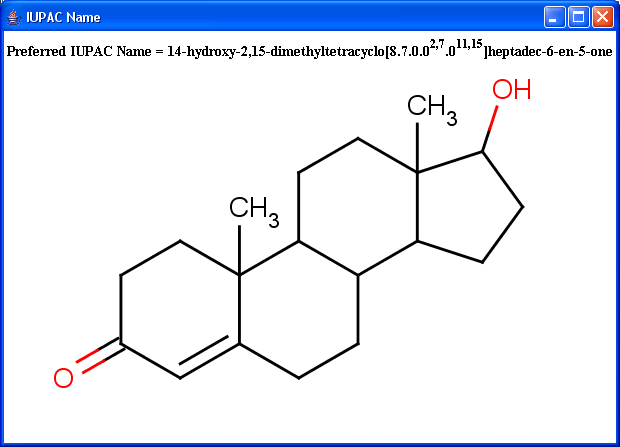
IUPAC naming plugin generates preferred IUPAC names, that conform (when possible) to the IUPAC Provisional Recommendations for the Nomenclature of Organic Chemistry published in 2004. Traditional names of the molecules can also be generated optionally.
 |
Most molecules contain some specific functional groups likely to
loose or gain proton under specific circumstances. Each ionization
equilibrium between the protonated or deprotonated forms of the molecule
can be described with a constant value called pKa. The
pKa plugin calculates the pKa values
of all proton gaining or loosing atoms on the basis of the partial
charge distribution.
Learn more about how the plugin calculates pKa.
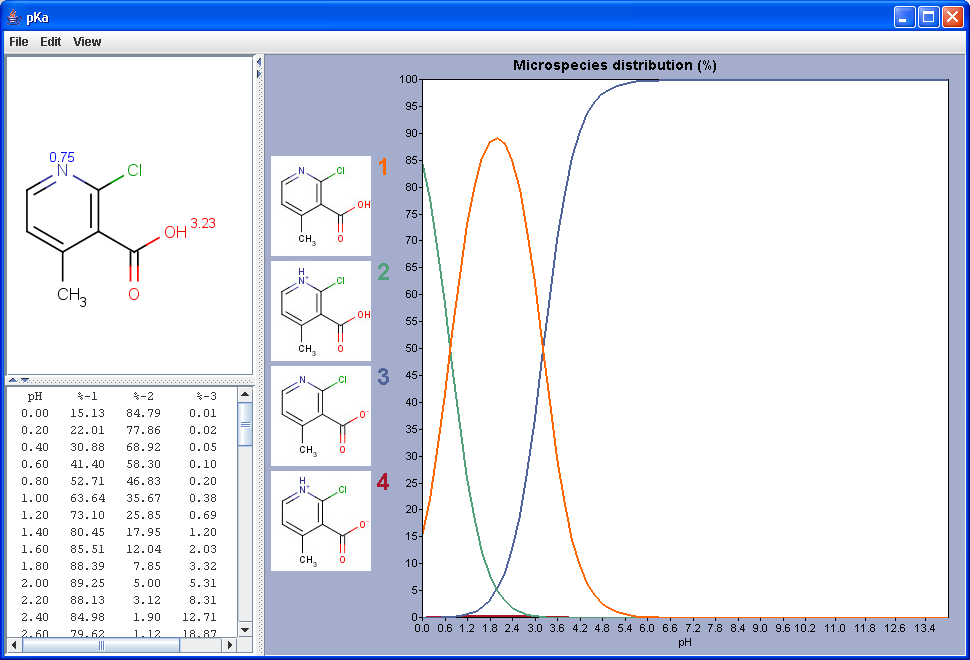 |
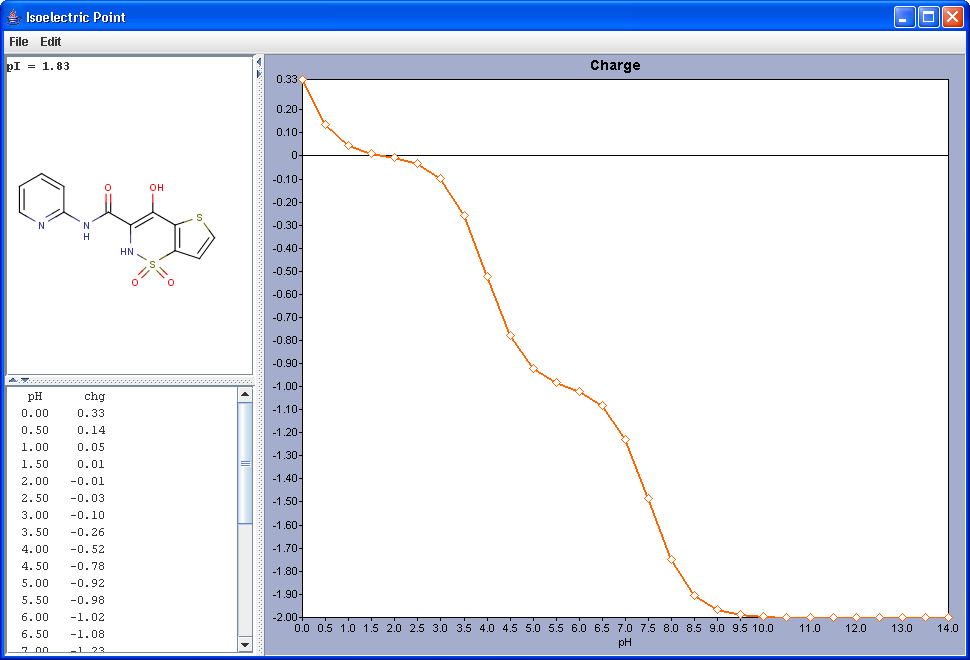
The chart shows the microspecies distribution curves by pH. The microspecies images are shown in the legend. When clicking on an image, the corresponding microspecies molecule is displayed in the upper-left viewer. The viewer can be detached from the chart panel by double clicking in it, or else by selecting Open Viewer from the View menu. The original molecule with the pKa values is shown when clicking on the chart outside of the legend image areas, or else when selecting pKa Values from the View menu.
Determines the major protonation form at a specified pH.
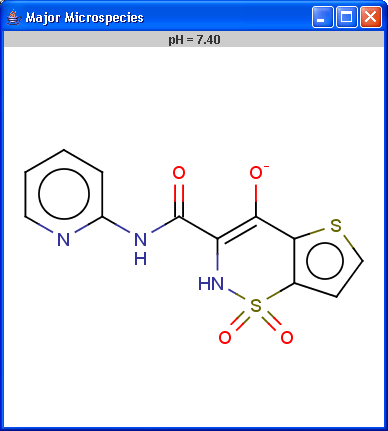 |
The pH can be set in the Options panel,
the default pH is 7.4.
Gross charge of an ionizable molecule is zero at certain pH. This pH is called as isoelectric point. Isoelectric point plugin calculates gross charge distribution of a molecule as function of pH.
 |
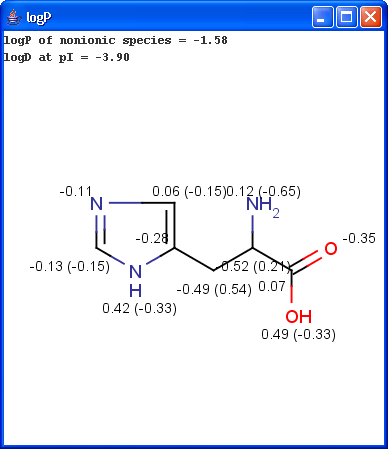
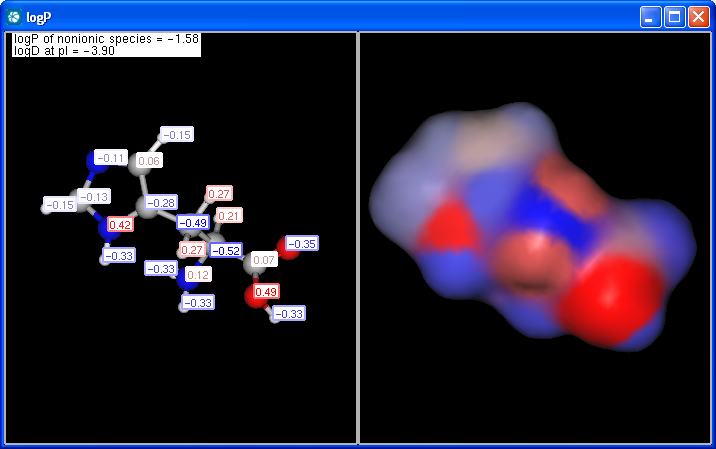
The logP plugin calculates the octanol/water partition
coefficient, which is used in QSAR analysis and rational drug design as
a measure of molecular hydrophobicity. The calculation method is based
on the publication of Viswanadhan et al.1
The logP value of a molecule is composed of the increment values
of its atoms. Though, logP is generally calculated for the
neutral molecule forms only, this plugin is able to handle ionic species
as well, owing to the improved algorithm.
Learn more about how the plugin calculates
logP.
 |
 |
The panel shows the logP increments for each atom. The numbers in brackets refer to the logP increment sums of implicit H atoms. This panel is displayed if Increments is selected from the Type listbox on the logP Options panel.
Compounds having ionizable groups exist in solution as a mixture
of different ionic forms. The ionization of those groups, thus the ratio
of the ionic forms depends on the pH. Since logP describes the
hydrophobicity of one form only, the apparent logP value can be
different. The octanol-water distribution coefficient2,
logD represents the compounds at any pH value.
Learn more about how the plugin calculates
logD.
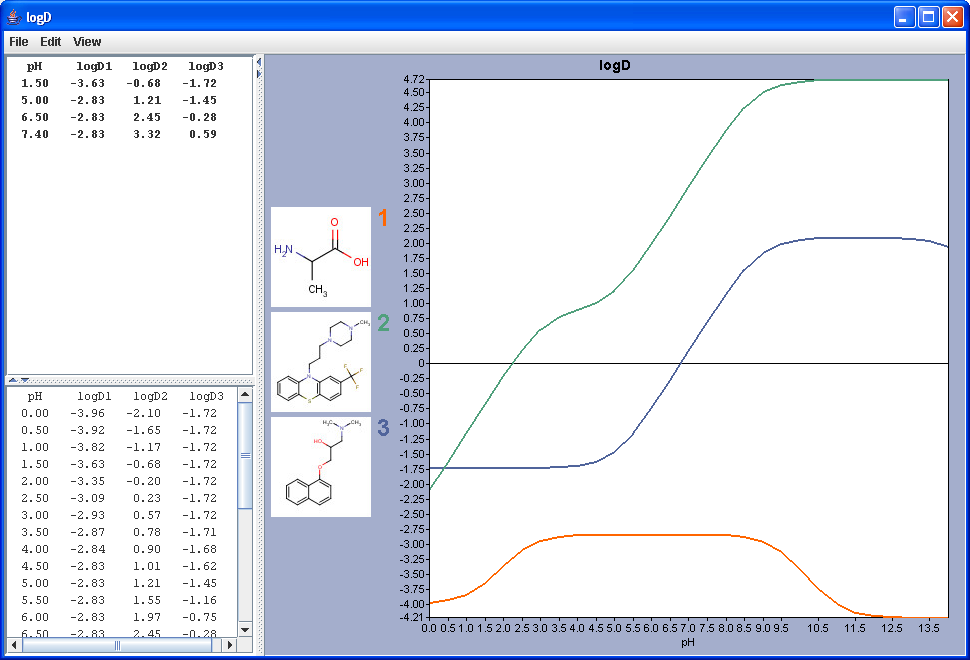 |
The chart shows the logD(pH) curves for each molecule drawn in the sketcher. The molecule images are shown in the legend. When clicking on an image, the corresponding molecule is displayed in the upper-left viewer. The viewer can be detached from the chart panel by double clicking in it, or else by selecting Open Viewer from the View menu. The reference logD values originally shown can be restored by either clicking on the chart outside of the legend image areas, or else by selecting logD at reference pH-s from the View menu.
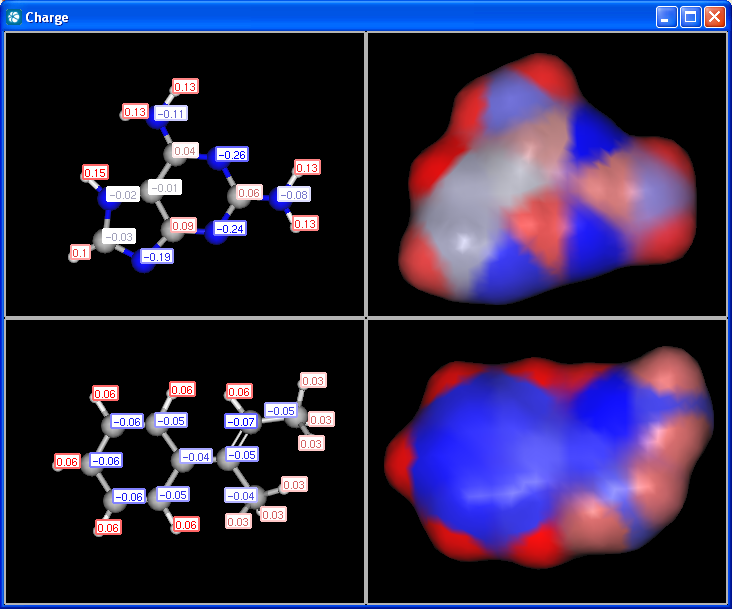
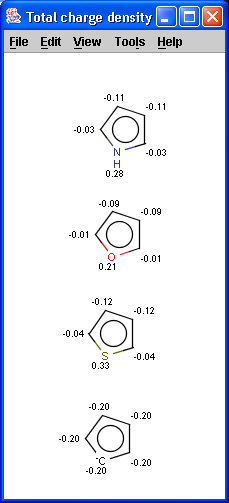
The partial charge distribution determines many physico-chemical
properties of a molecule, such as ionization constants, reactivity and
pharmacophore pattern. Use Charge plugin to compute the partial charge
value of each atom. Total charge is calculated from sigma and pi charge
components, any of these three charge values can be displayed.
Learn more about how the plugin calculates the
partial charge.
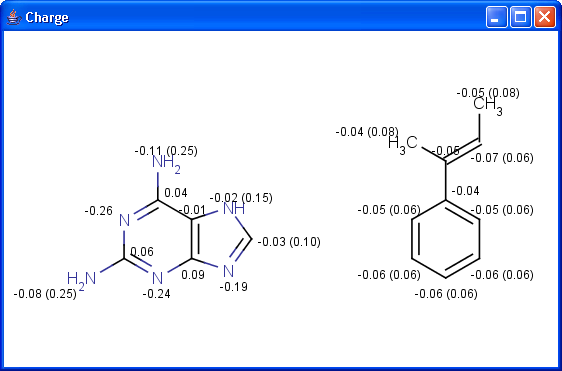 |
The numbers in brackets refer to the charge sums of implicit H atoms.
 |
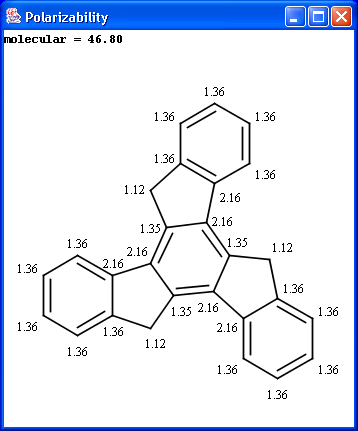
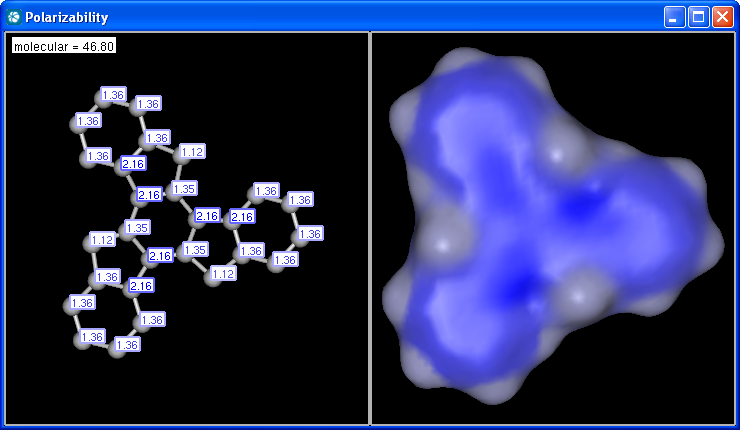
The electric field generated by partial charges of a molecule spread through intermolecular cavities and the solvent that the molecule is solved within. The induced partial charge (induced dipole) has a tendency to diminish the external electric field. This phenomenon is called as polarizability. The more stable each ionized site is the more its vicinity is polarizable. This is why atomic polarizability is an important factor in the determination of pKa and why it is considered in our pKa calculation plugin. Atomic polarizability is altered by partial charges of atoms. Our calculation is based on 3, and takes into account the effect of partial charge upon atomic polarizability.
 |
 |
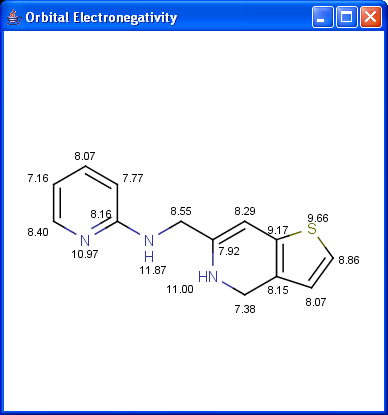
Partial charge distribution of the molecule is governed by the
orbital electronegativity of the atoms contained in the molecule.
Learn more about how the plugin calculates
orbital electronegativity.
 |
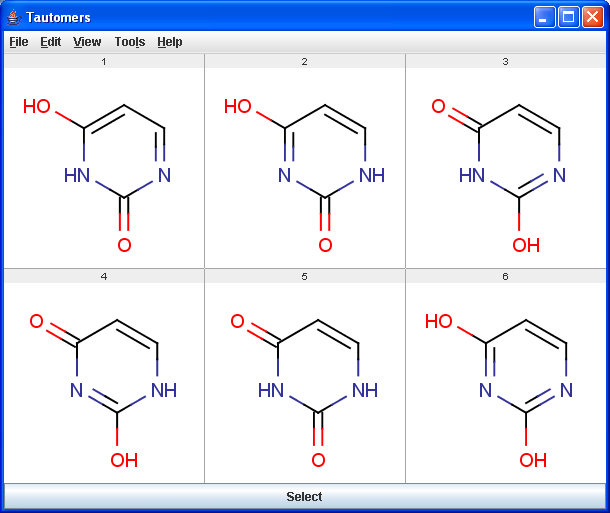
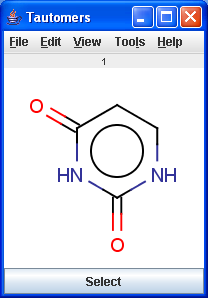
Tautomers are structural isomers which are in dynamic equilibrium due to the migration of protons. All tautomers of a compound can be determined with the help of the Tautomerization plugin. For example the next six structures (on the left) are the calculated tautomers of pyrimidine-2,4-diol. The plugin is also able to generate the canonical tautomeric form (the generated canonical tautomer of pyrimidine-2,4-diol can be seen on the right).
 |
 |
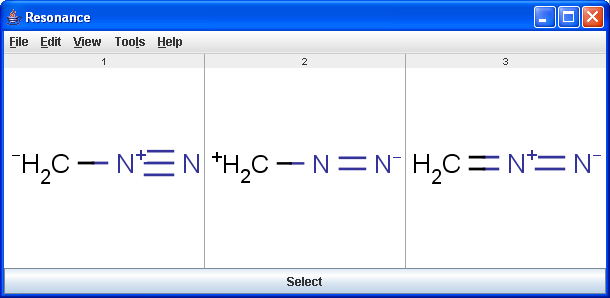
The Resonance plugin generates all resonance forms of a molecule. The major contributors of the resonance structures can be calculated separately. For example the next three structures are the major resonance contributors of diazomethane.
 |
The Stereoisomer plugin produces all possible stereoisomers of a given compound. The plugin handles both tetrahedral and double bond stereo centers.
 |
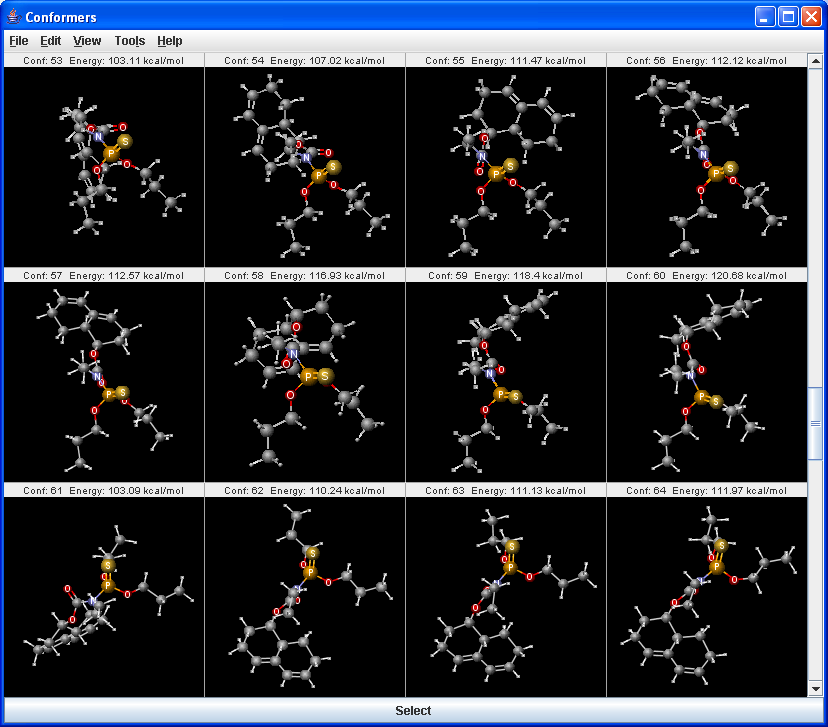
Conformer plugin can generate selected number of conformers or the lowest energy conformer of a molecule. For conformer calculation Dreiding force field is used. The 3D structure (conformation) strongly affects the properties and the reactions of the molecules.
 |
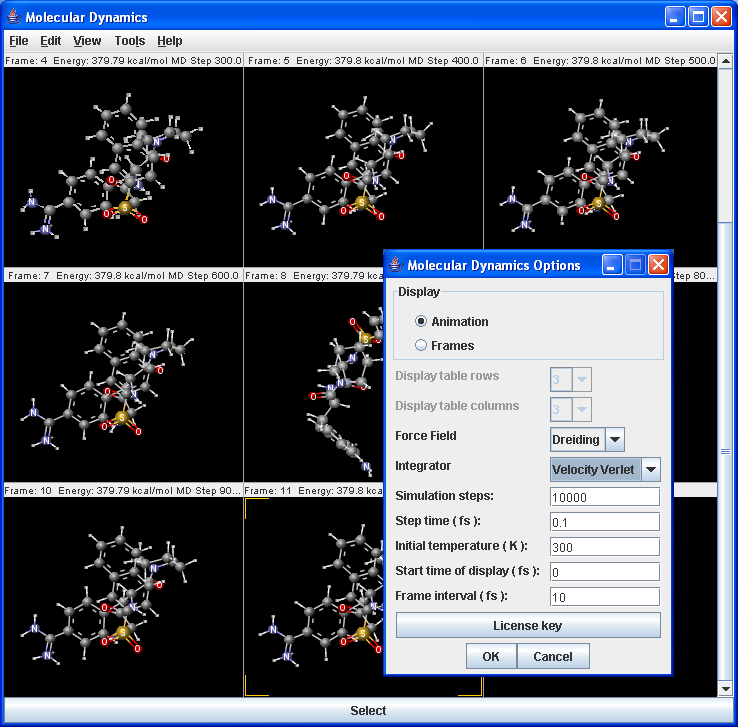
The molecular dynamics plugin calculates the configurations of the system by integrating Newton's laws of motion.
 |
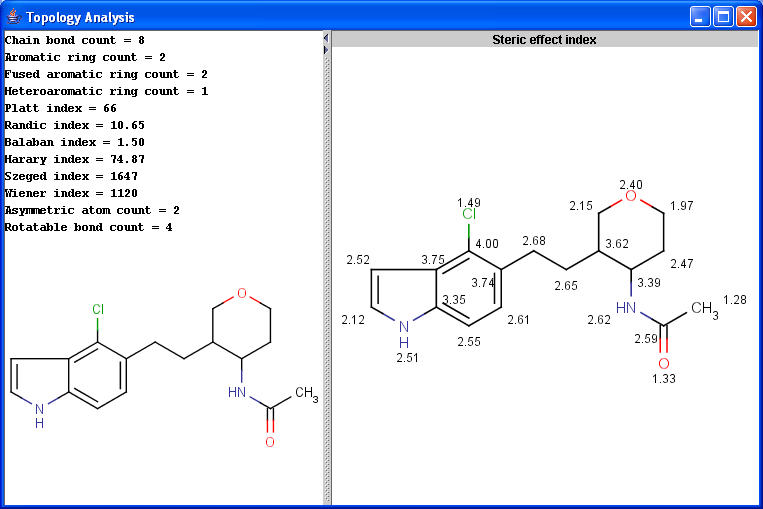
The Topology Analysis plugin provides characteristic values related to the topological structure of a molecule.
Simple
Ring
Path based
Distance based
Other
 |
The Geometry plugin provides characteristic values related to the geometrical structure of a molecule. As input molecule it can use the user input or take the lowest energy conformer of the input molecule.
Calculations
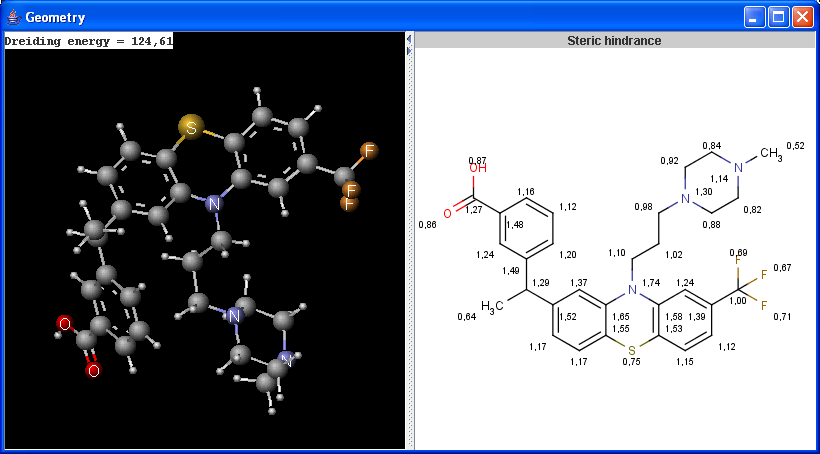 |
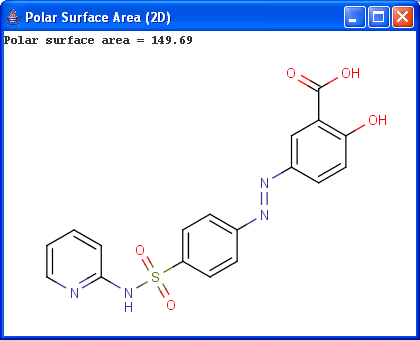
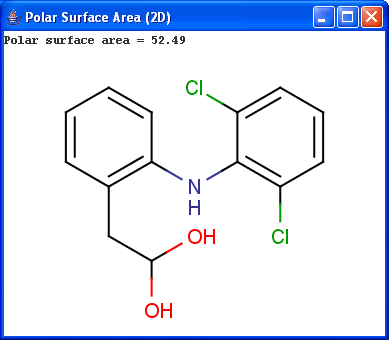
Polar surface area (PSA) is formed by polar atoms of a molecule. It is a descriptor that shows good correlation with passive molecular transport through membranes, and so allows estimation of transport properties of drugs. Estimation of topoligical polar surface area (TPSA) is based on the method given in 4. The method provides results which are practically identical with the 3D PSA, while calculation time of TPSA is approximately 100-times faster. This method is more suitable for fast bioavailability screening of large virtual libraries.
 |
 |
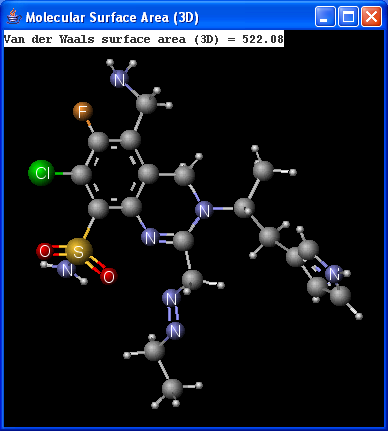
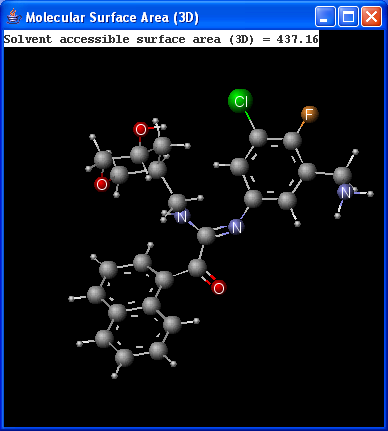
There are two types of available molecular surface area calculations: Van der Waals and solvent accessible. Calculation method is based on the publication of Ferrara et al.6.
 |
 |
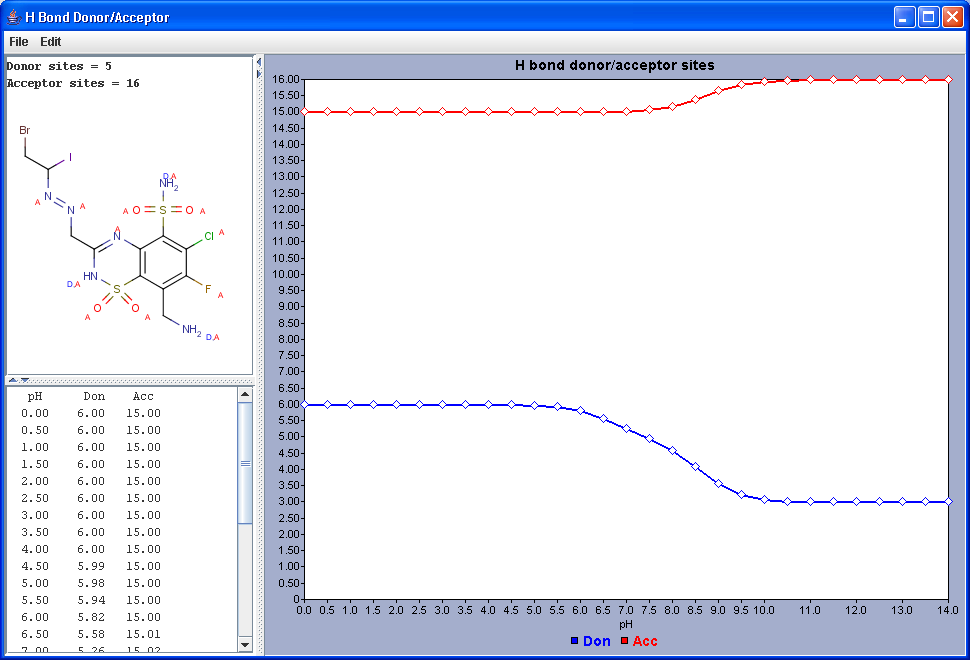
Hydrogen Bond Donor-Acceptor calculates atomic hydrogen bond donor and acceptor inclination. Atomic data and overall hydrogen bond donor and acceptor multiplicity are displayed for the input molecule (or its physiological microspecies at a given pH). The weighted average hydrogen bond donor and acceptor multiplicities taken over the microspecies th proportions of their occurrences are computed for different pH-s and displayed in a chart.
 |
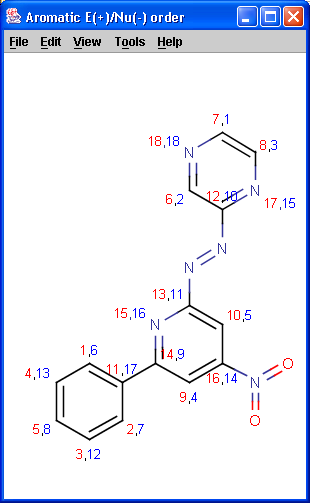
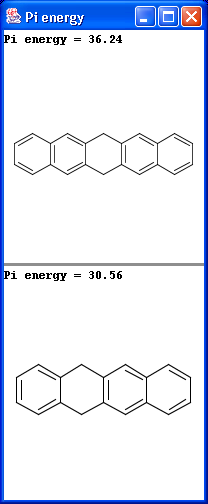
Localization energies L(+) and L(-) for electrophilic and nucleophilic attack at an aromatic center are calculated by the Hückel method. The smaller L(+) or L(-) means more reactive atomic location. Order of atoms in E(+) or in Nu(-) attack are adjusted according to their localization energies. The total pi energy, the pi electron density and the total electron density are also calculated by the Hückel method.
Theoretical background is given in Neil S. Isaacs5.
 |
 |
 |
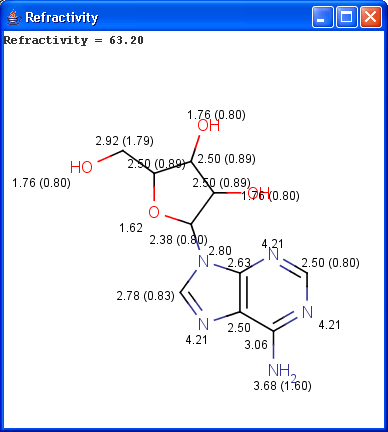
Our calculation is based on the atomic method proposed by Viswanadhan et al.1. Molar refractivity is strongly related to the volume of the molecules and to London dispersive forces that has important effect in drug-receptor interaction.
 |
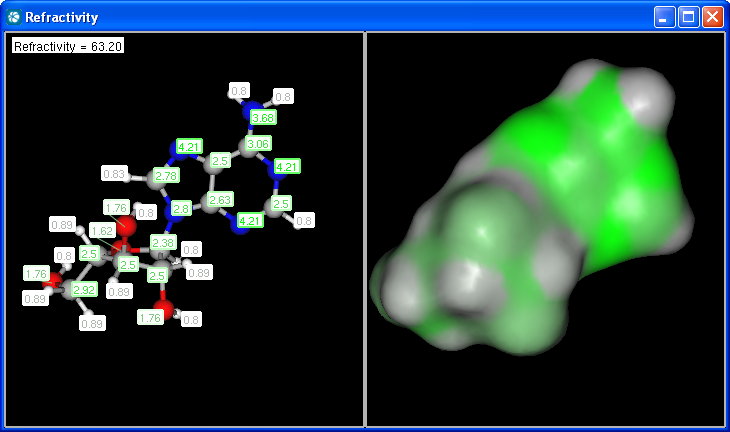 |
The numbers in brackets refer to the refractivity sums of implicit H atoms.
Copyright © 1998-2007 ChemAxon Ltd.